The State Diagram, also known as the State Machine Diagram, is a technique used to describe behavior. It shows the possible states of an object during its lifecycle and the events that cause state changes.
# Components
-
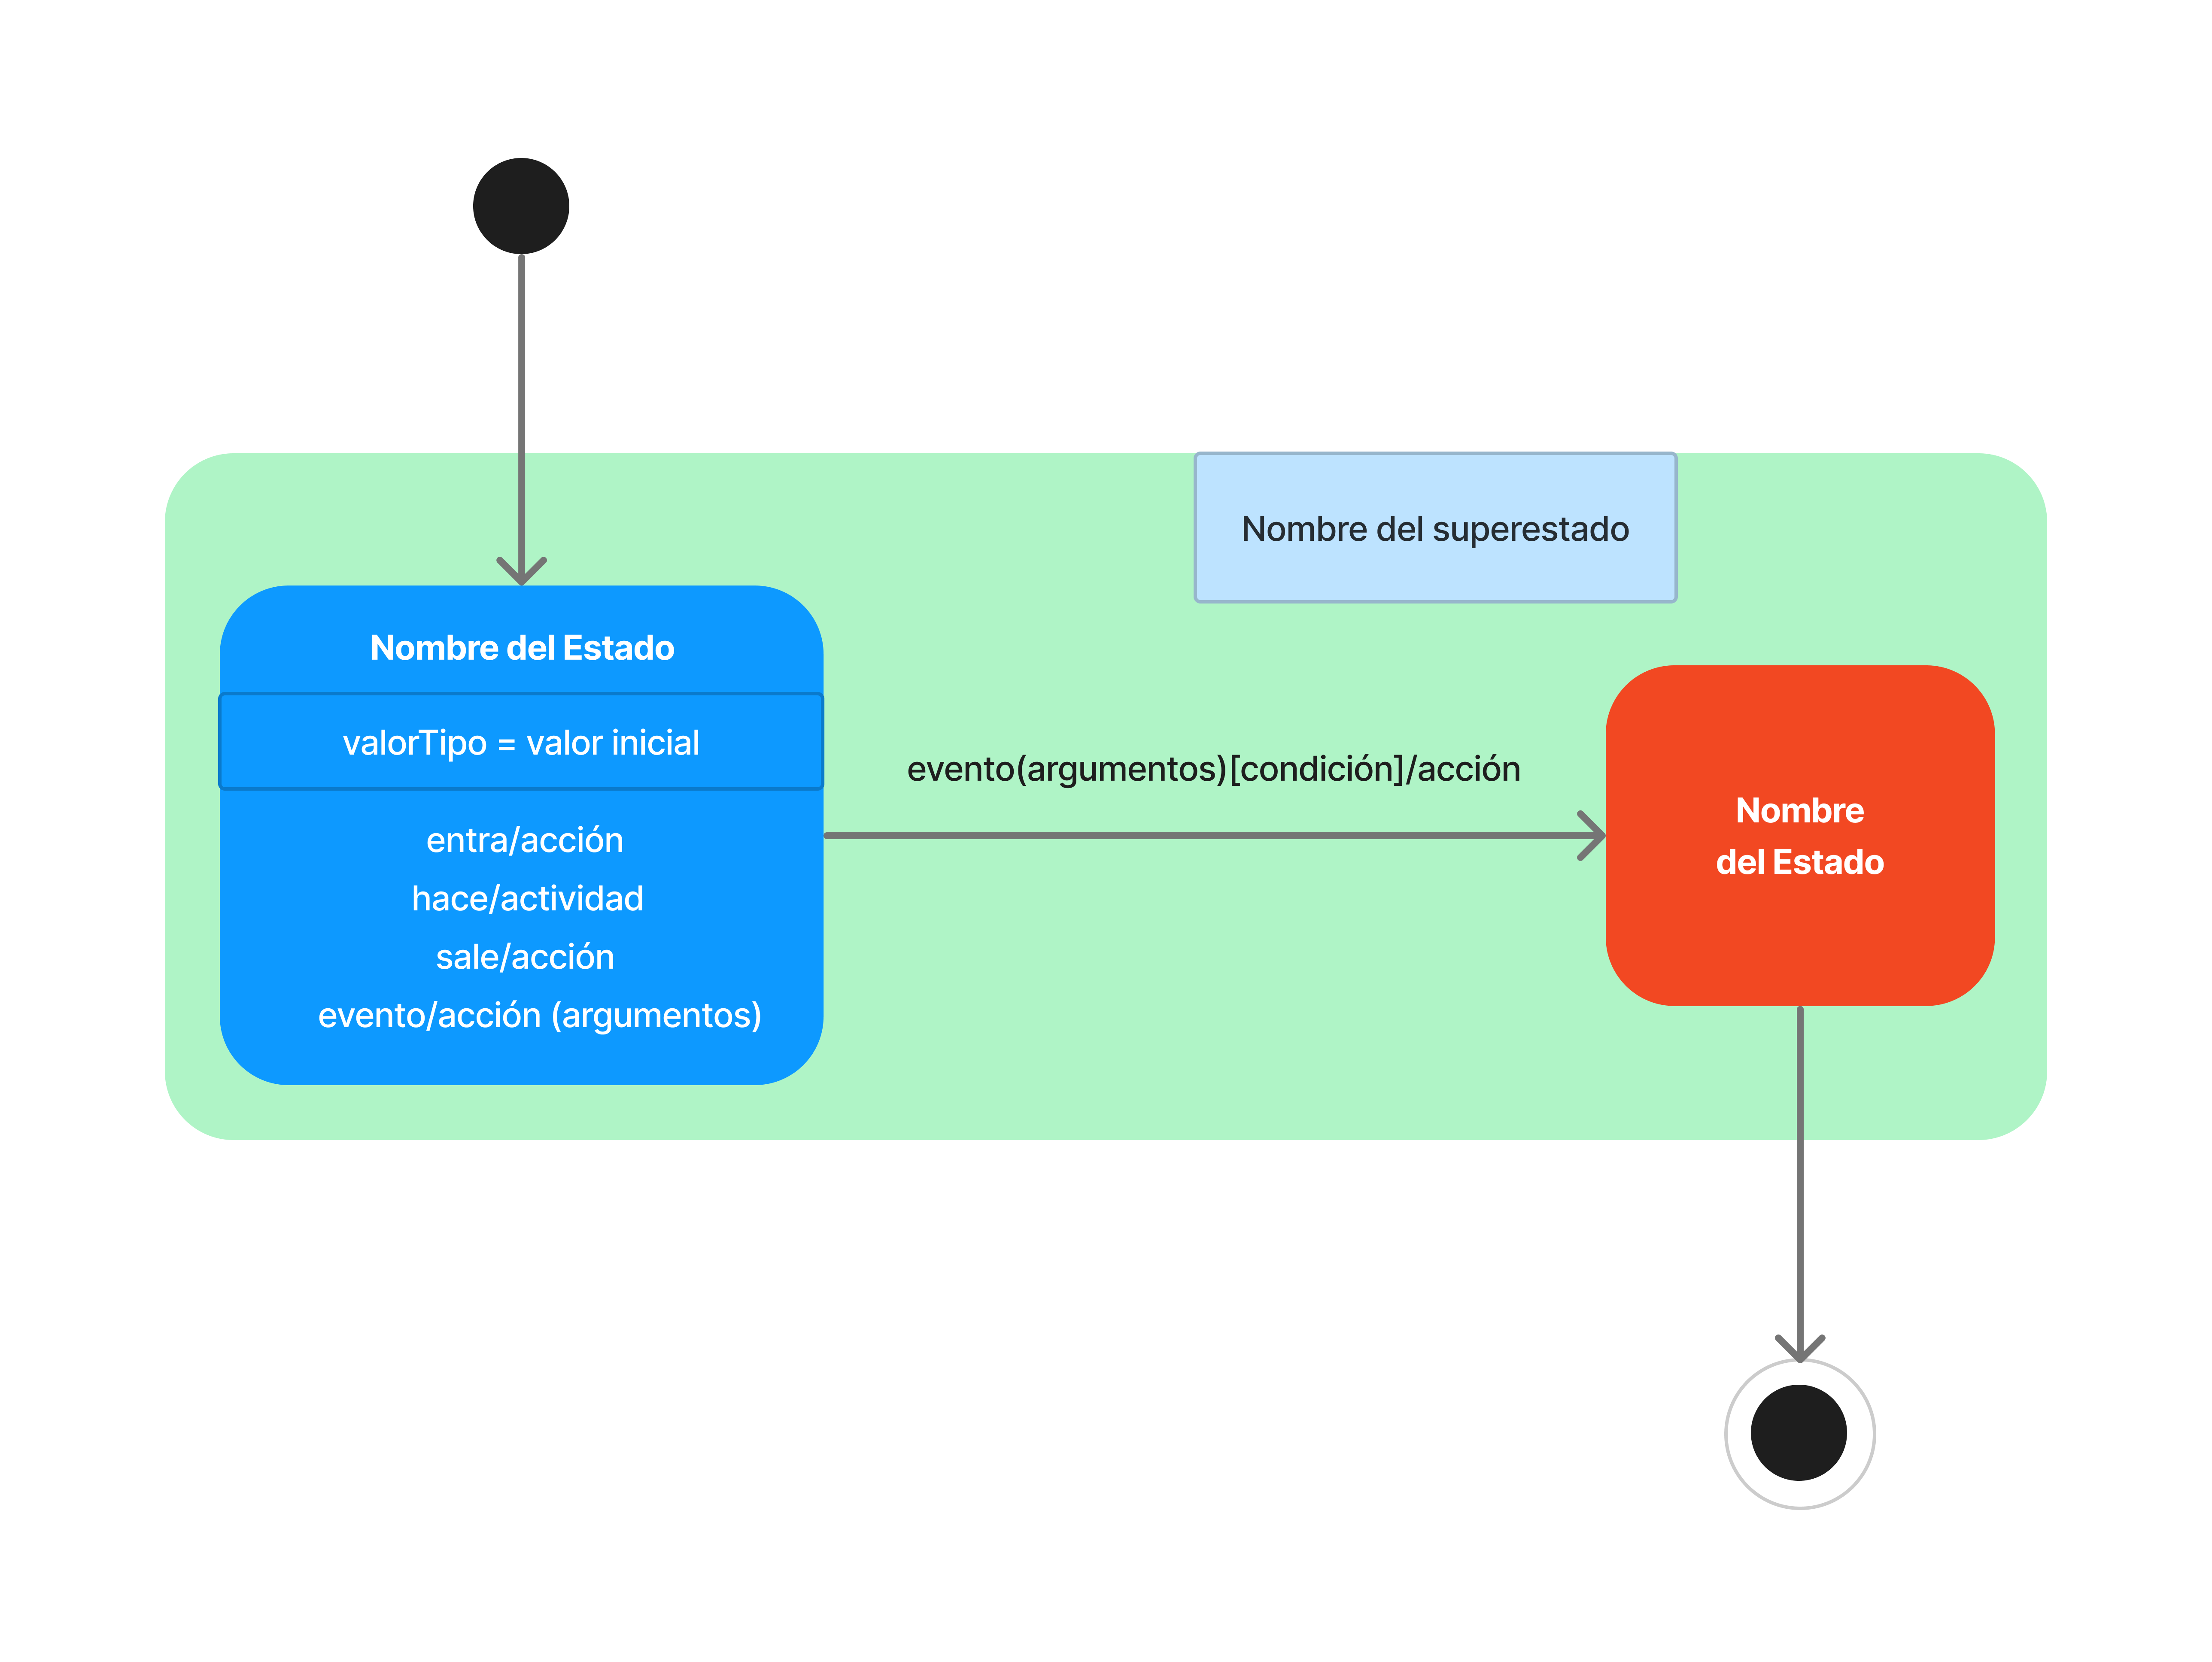
States: Situations or conditions during the life of the object (rounded rectangles).
-
Transitions: Arrows that connect the states.
-
Events: Triggers for changes.
-
Actions: Quick processes associated with the transition (e.g., "get first item").
-
Guards: Logical conditions in square brackets (e.g., "[All items checked]").
Syntax: Event [Guard] / Action
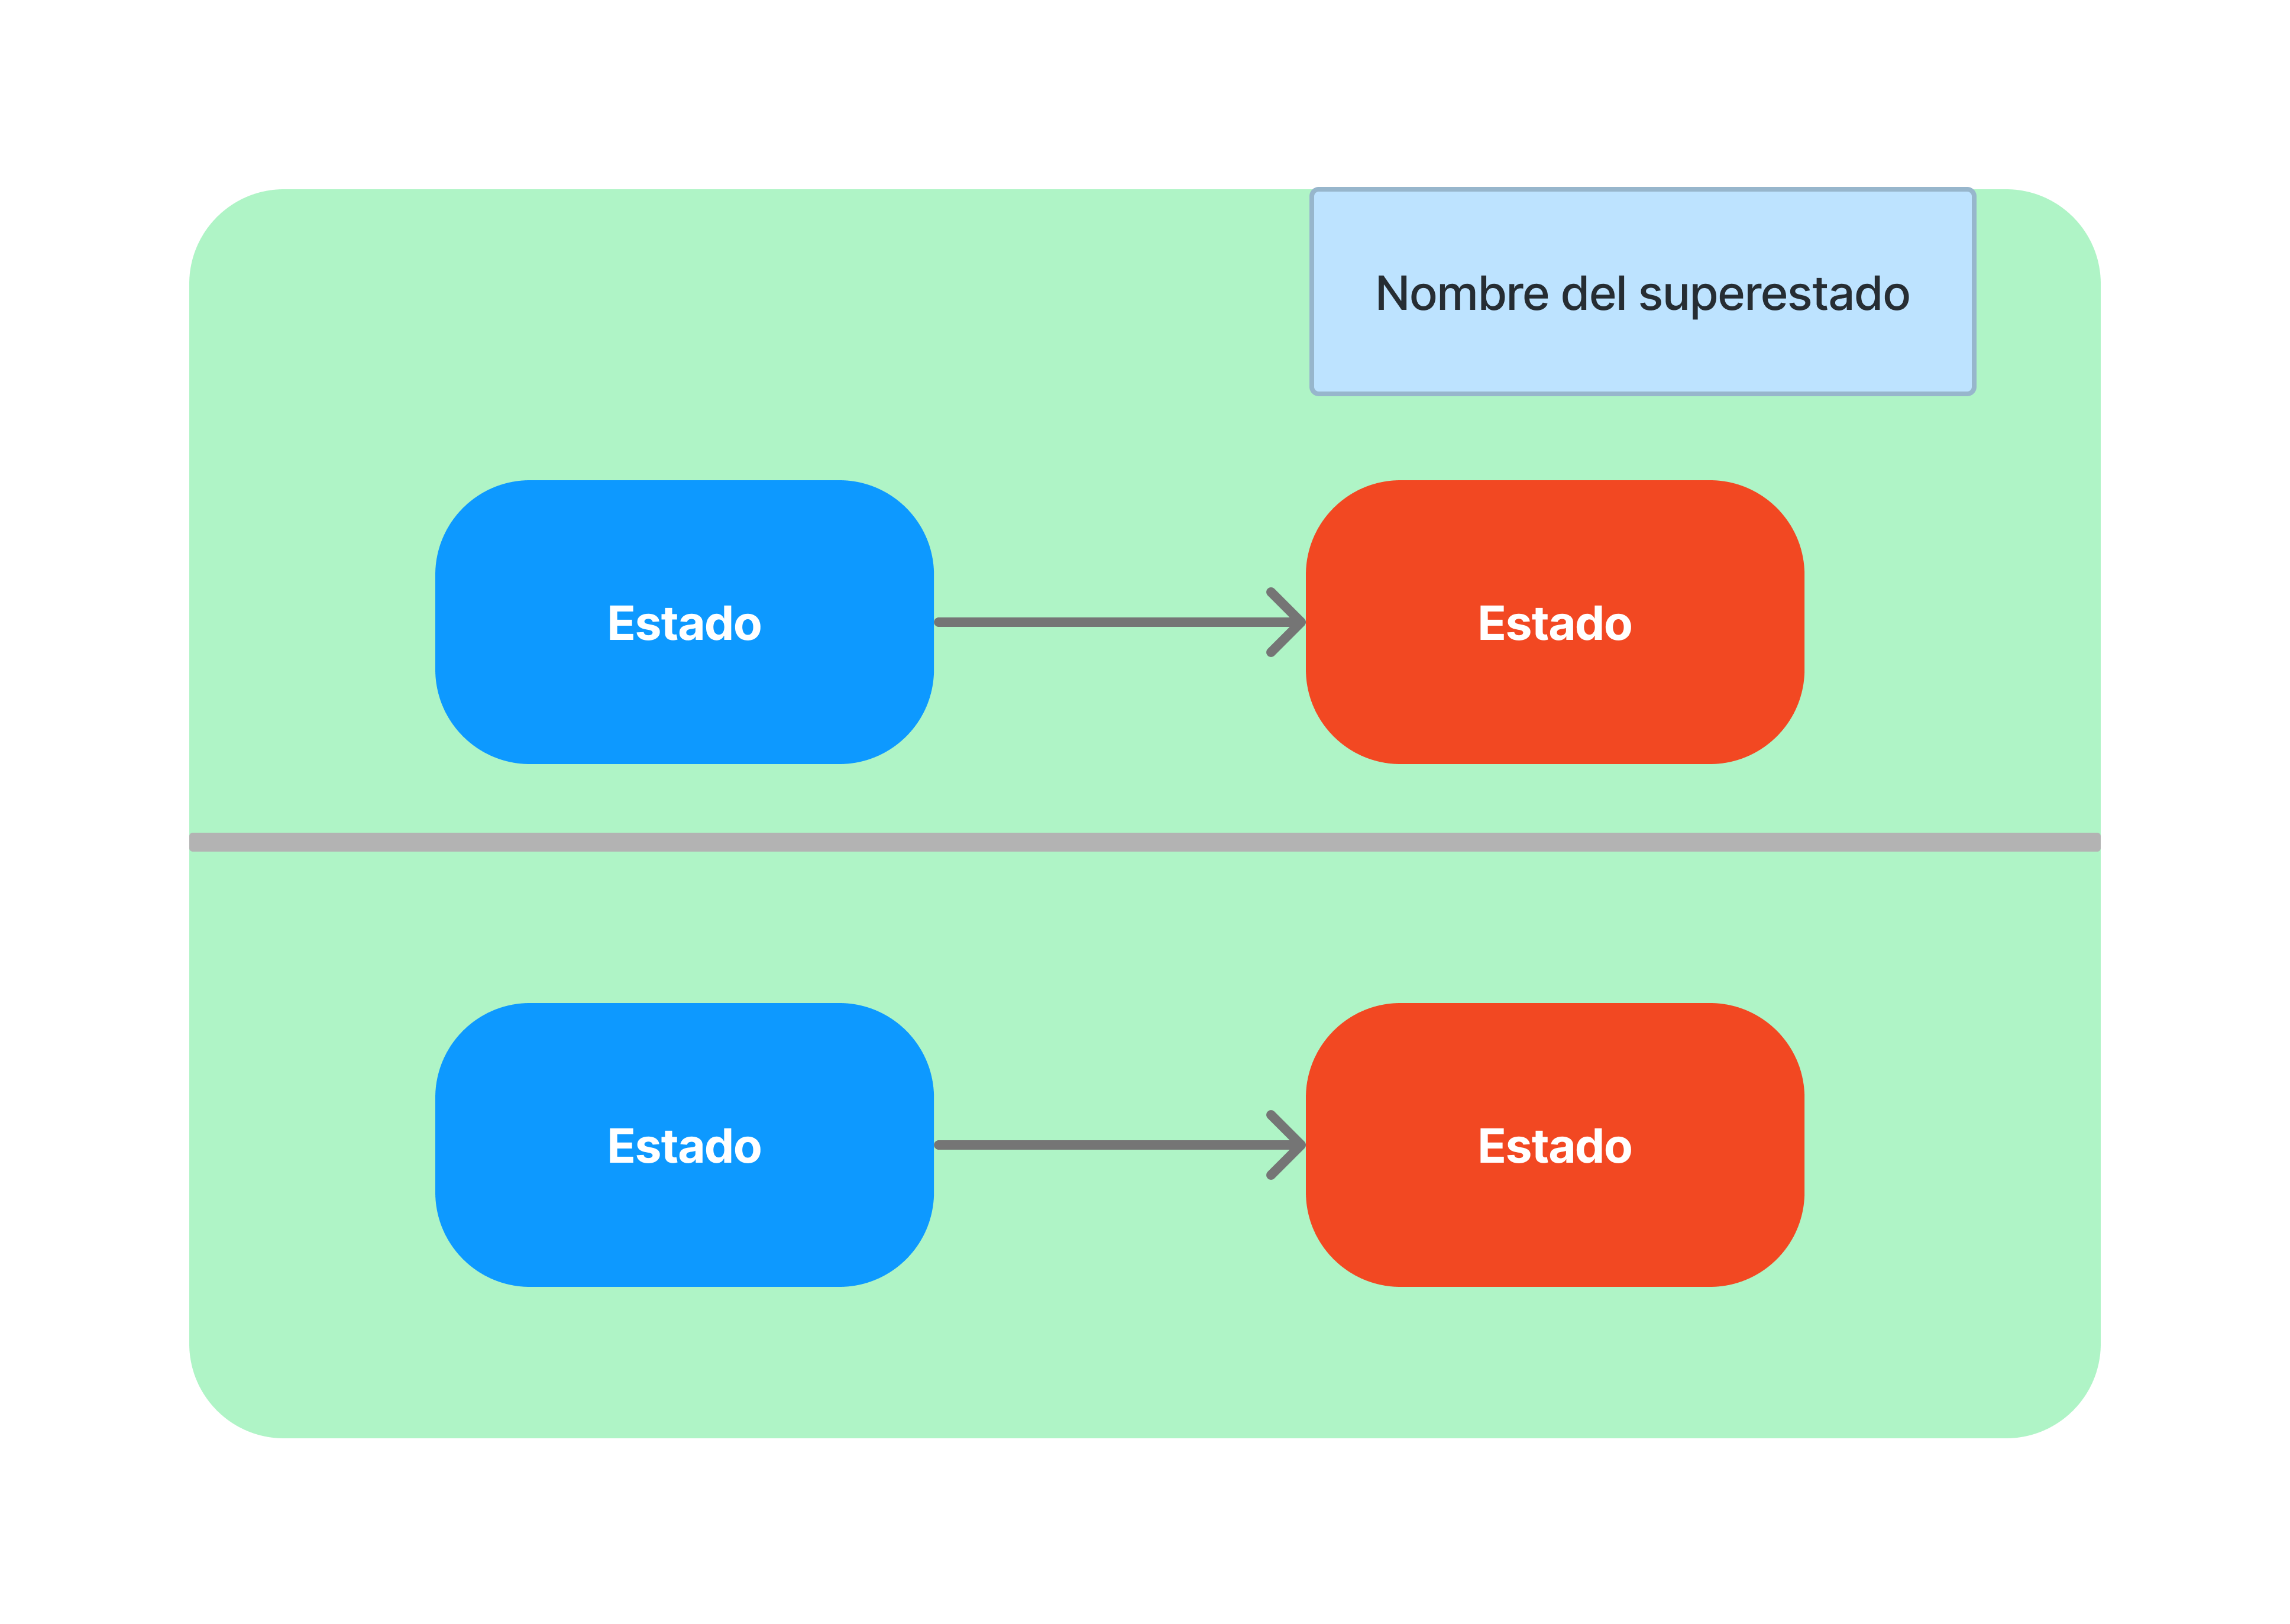
Concurrent States
We can model concurrent states by dividing the superstate.
# Example: Order Lifecycle
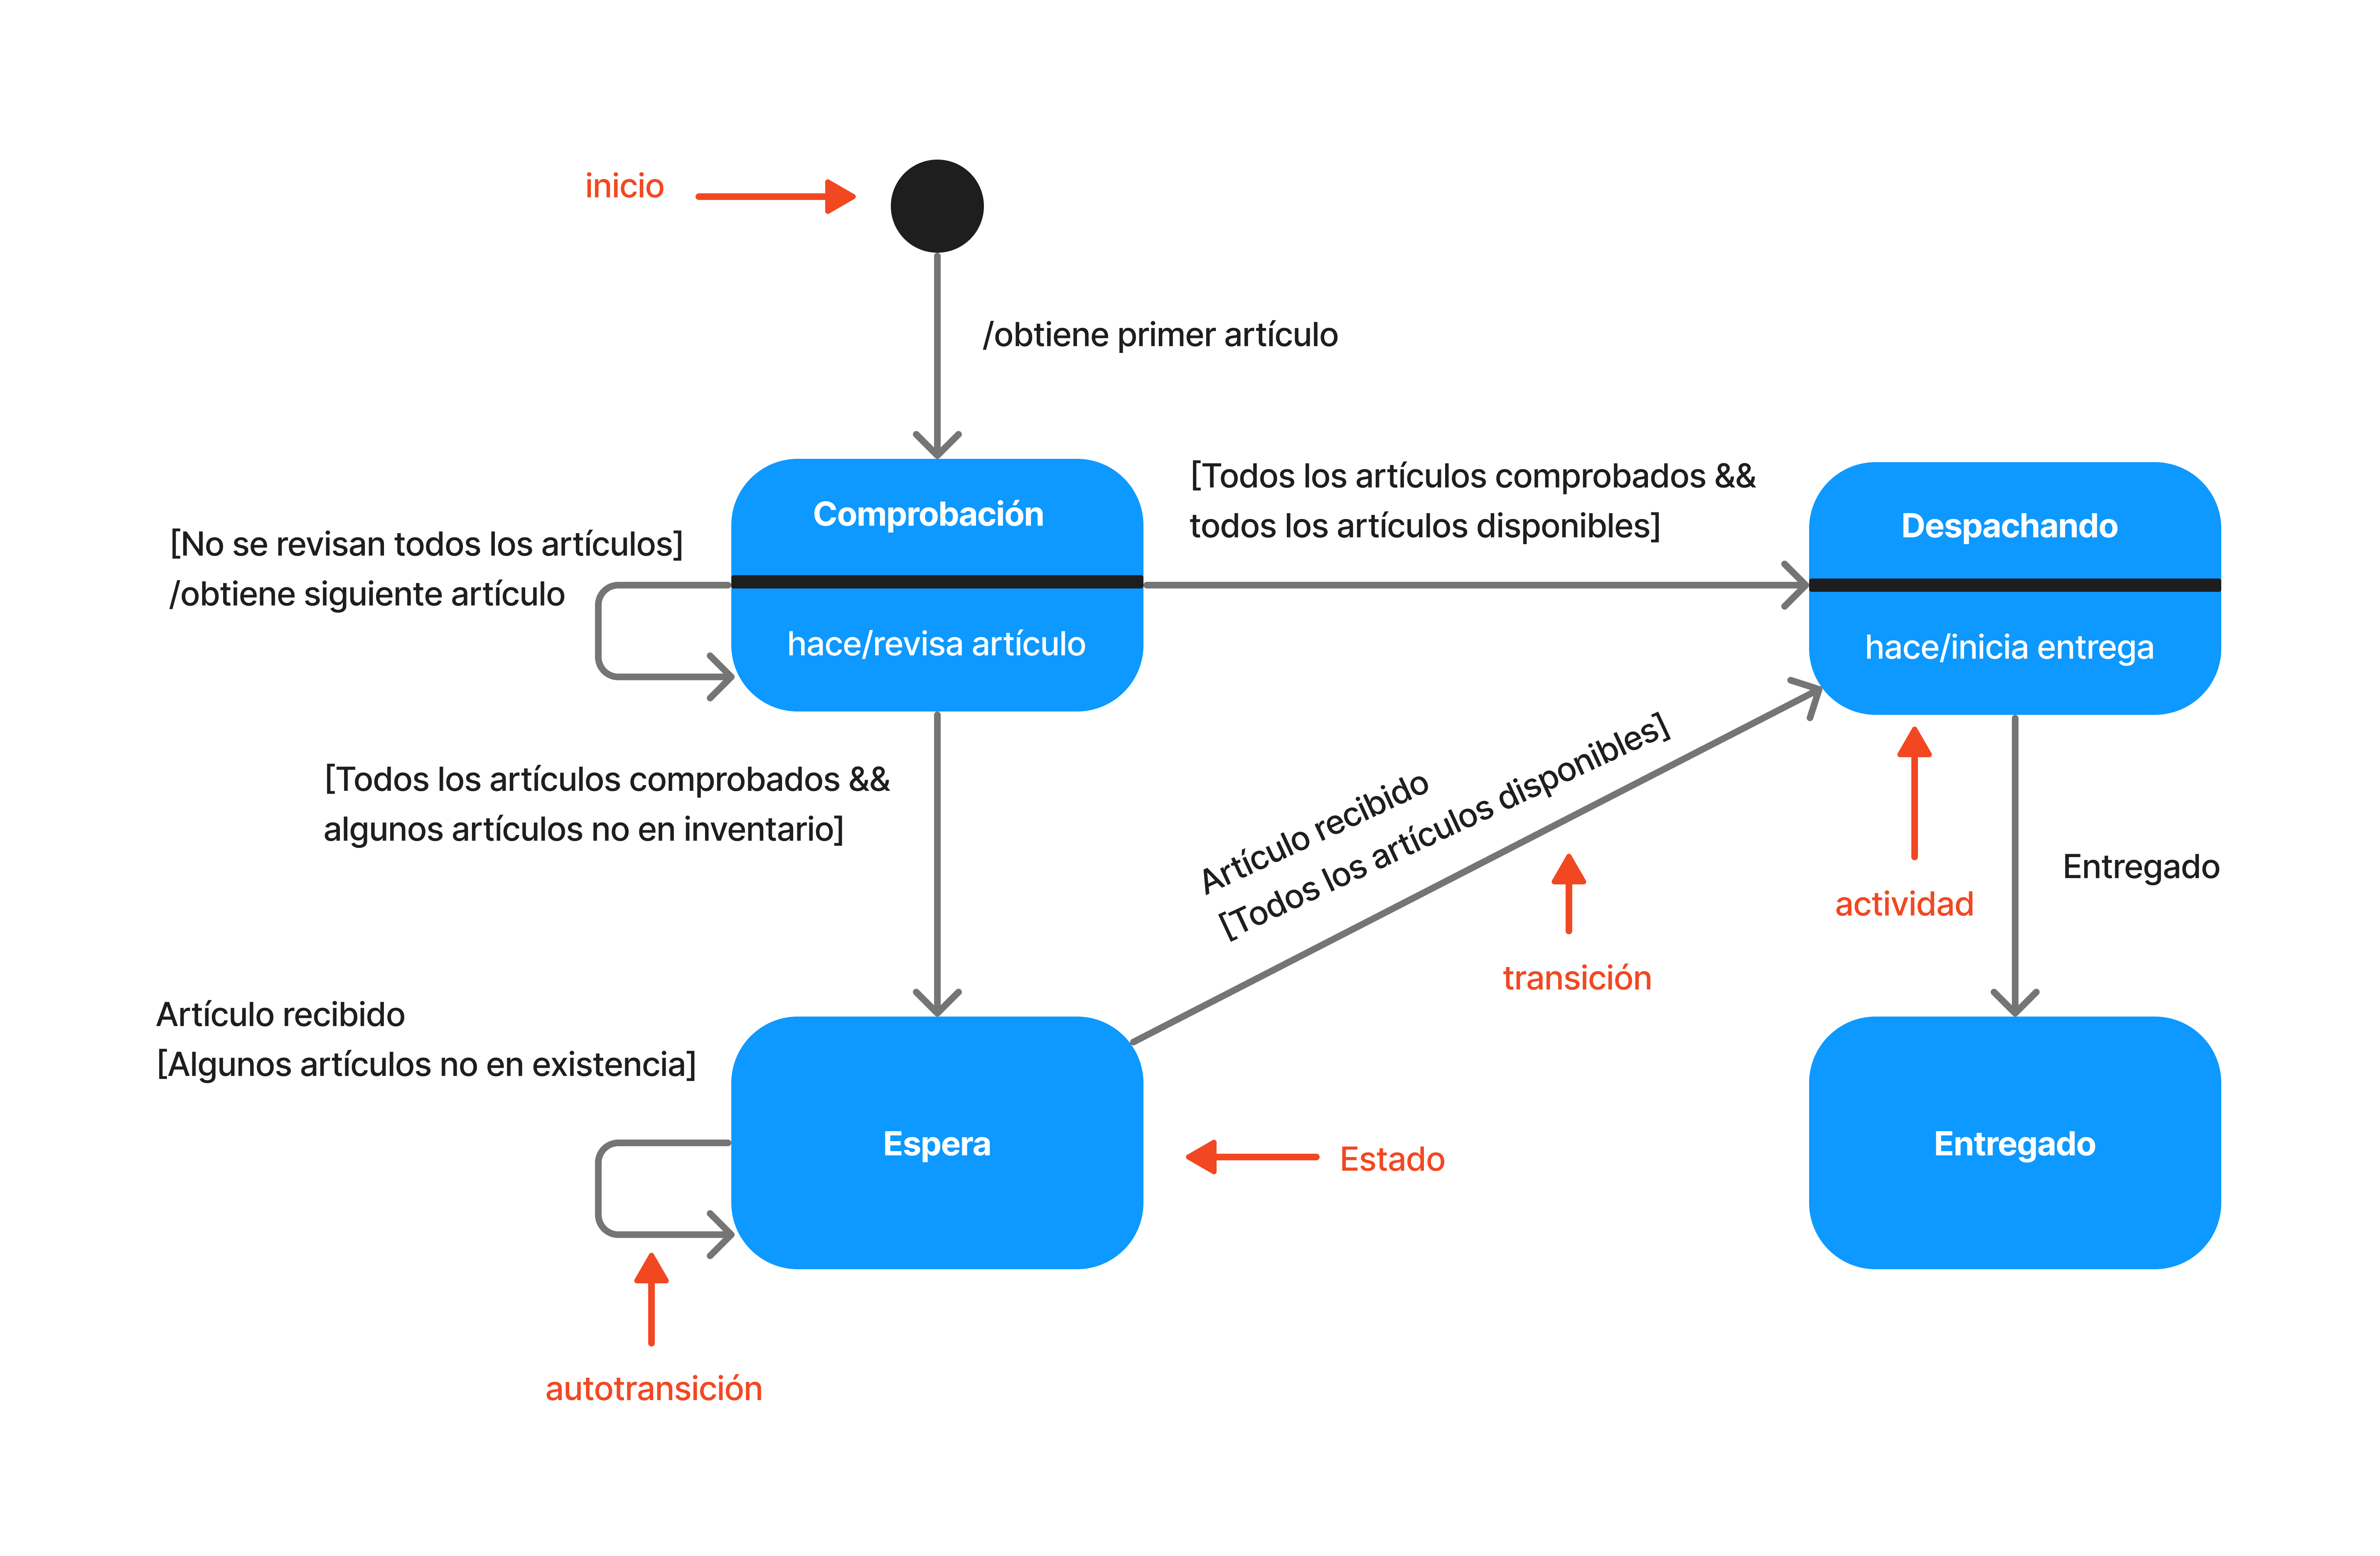
Checking
Initial state after creation. The system performs item checks. If items are missing, it moves to 'Waiting'; if everything is ready, it moves to 'Dispatching'.
Waiting
The system waits for out-of-stock items to arrive. It remains until the guard is met.
Dispatching
Physical delivery of the order begins once global availability is confirmed.
Delivered
Final state indicating successful receipt by the customer.
# Purpose
-
Model dynamic behavior of an entity.
-
Specify reactions to temporal events.
-
Valuable in complex and embedded systems.
# Advantages
-
done_all
Clear vision of all possible states.
-
done_all
In-depth behavioral analysis to detect failures.
-
done_all
Detailed design of control logic.
# Conclusions
The state diagram is useful for modeling object behavior over time. It provides a detailed understanding of the states an object can pass through and how it responds to specific events.
Despite its tendency toward complexity in large-scale applications, it remains essential for the analysis and design of systems that require detailed object state management.