Here you will learn to create the famous flowchart, something that allows you to think of an algorithm visually, easier to understand and useful for communicating with other programmers. I will explain the symbols and elements used, and we will do several exercises, from easy to difficult. We will also compare code with a flowchart.
# Introduction to flowcharts
One of the representation systems (the way we perceive things that happen in the world) is the visual system.
According to Neuro-Linguistic Programming (NLP), those in whom the visual system predominates understand things better through graphics and images.
If you are in this group, flowcharts will help you understand programming better.
# What is a flowchart?
A flowchart is a graphical representation of an algorithm; that is, through a drawing, we model a process, and in this way we can think about it, see it, and understand it, without having to read the code.
When I talk about a process, I refer to the complete algorithm, or parts of the algorithm; in large programs sometimes only the most complex parts or some particular functions are modeled.
# Symbols used in flowcharts
To build a flowchart, a standard set of symbols corresponding to geometric shapes is used:
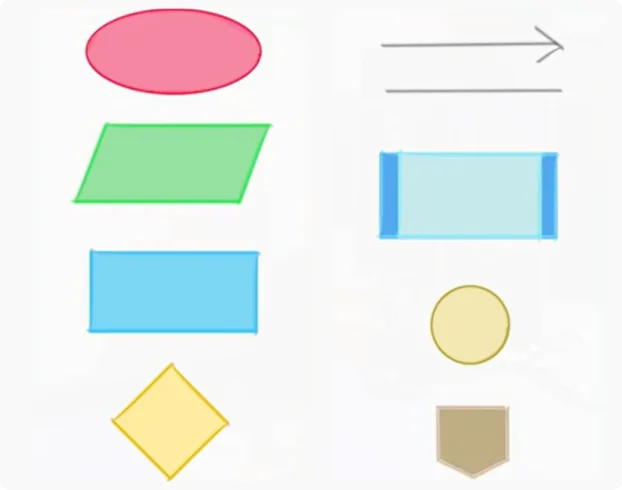
- The oval or terminal marks the "start" and "end" of a process
- The parallelogram ? Input/Output (reading data or printing results)
- The rectangle ? Process (any operation that changes some value, arithmetic operations, transfer, assignments)
- The rhombus (diamond) ? Decision (represents logical or comparison operations and, depending on its result, indicates the path to follow). For example, Age > 18; if the answer is YES, I print ("Is an Adult"); if the answer is NO, I print "Is a Minor"
- The arrow ? Indicates in which direction the operations go.
- The Line ? which serves to connect two symbols
- The rectangle with borders ? Call to a process (an independent module from the one we are modeling); it can represent a call to a function
- The circle ? Connector (used to connect two or more inputs to the same output) within the same page
- The pentagon ? Another connector, connects two points when changing pages
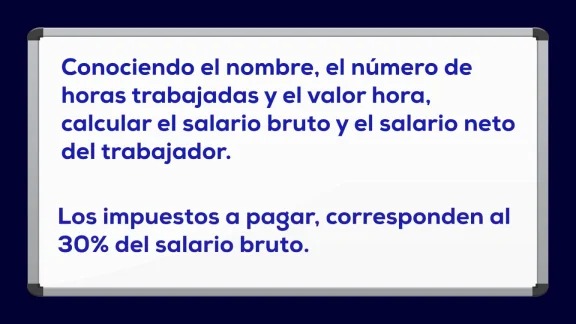
# Simple Exercise - Gross and net salary calculation
First we mark the start, we begin with the oval. We must read the name, hours, and hour_value; we use a parallelogram (name, hours, and hour_value are 3 variables).
Now we calculation the gross salary, using a process (the rectangle); to the gross_salary variable we assign hours * hour_value.
We are going to calculate the taxes to obtain the net salary, using another process; to the taxes variable we assign 0.3 * gross_salary.
And we open another process to the net_salary variable we assign gross_salary minus taxes.
Finally we show the results; with a parallelogram we print name, gross_salary, and net_salary.
And we finish the program or process with an oval for end.
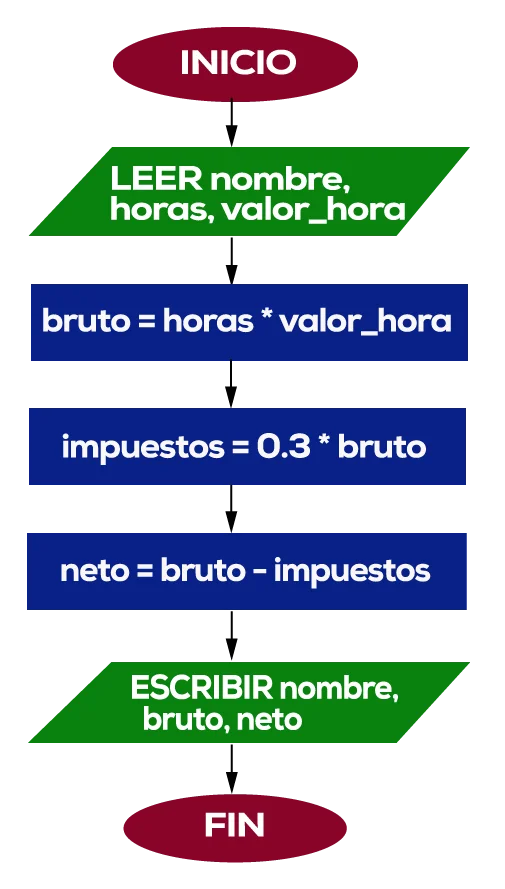
This is the flowchart of this simple process; it is sequential.
With practice, by seeing this we understand how the algorithm is or how to implement it.
In some companies, analysts build diagrams like these and programmers translate them into code.
Something important! We can make the flowchart before programming; it might be easier to think about a complex algorithm graphically, and I can also do it after, to document the code so another programmer understands it.
# Medium Exercise - Average calculation of a series of numbers
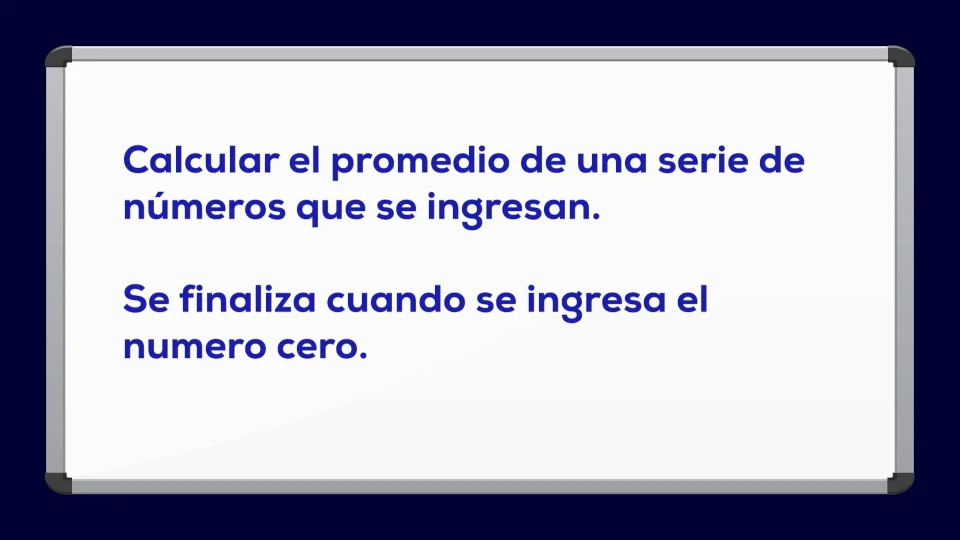
We have to ask to enter a number; this is a cycle.
We are going to have to sum all the numbers and divide them by the quantity of numbers entered:
- We read the number
- If it is different from zero, we must sum the number to all previous ones, an accumulator, a variable sum
- We are going to increment the number of elements entered, a counter
- We ask again to enter a number
- And we repeat the cycle
- If it is zero we exit the cycle, calculate the average and show results.
We must take into account that we cannot divide by 0, so if the quantity is zero, we have to assign it 1. Let's make the diagram:
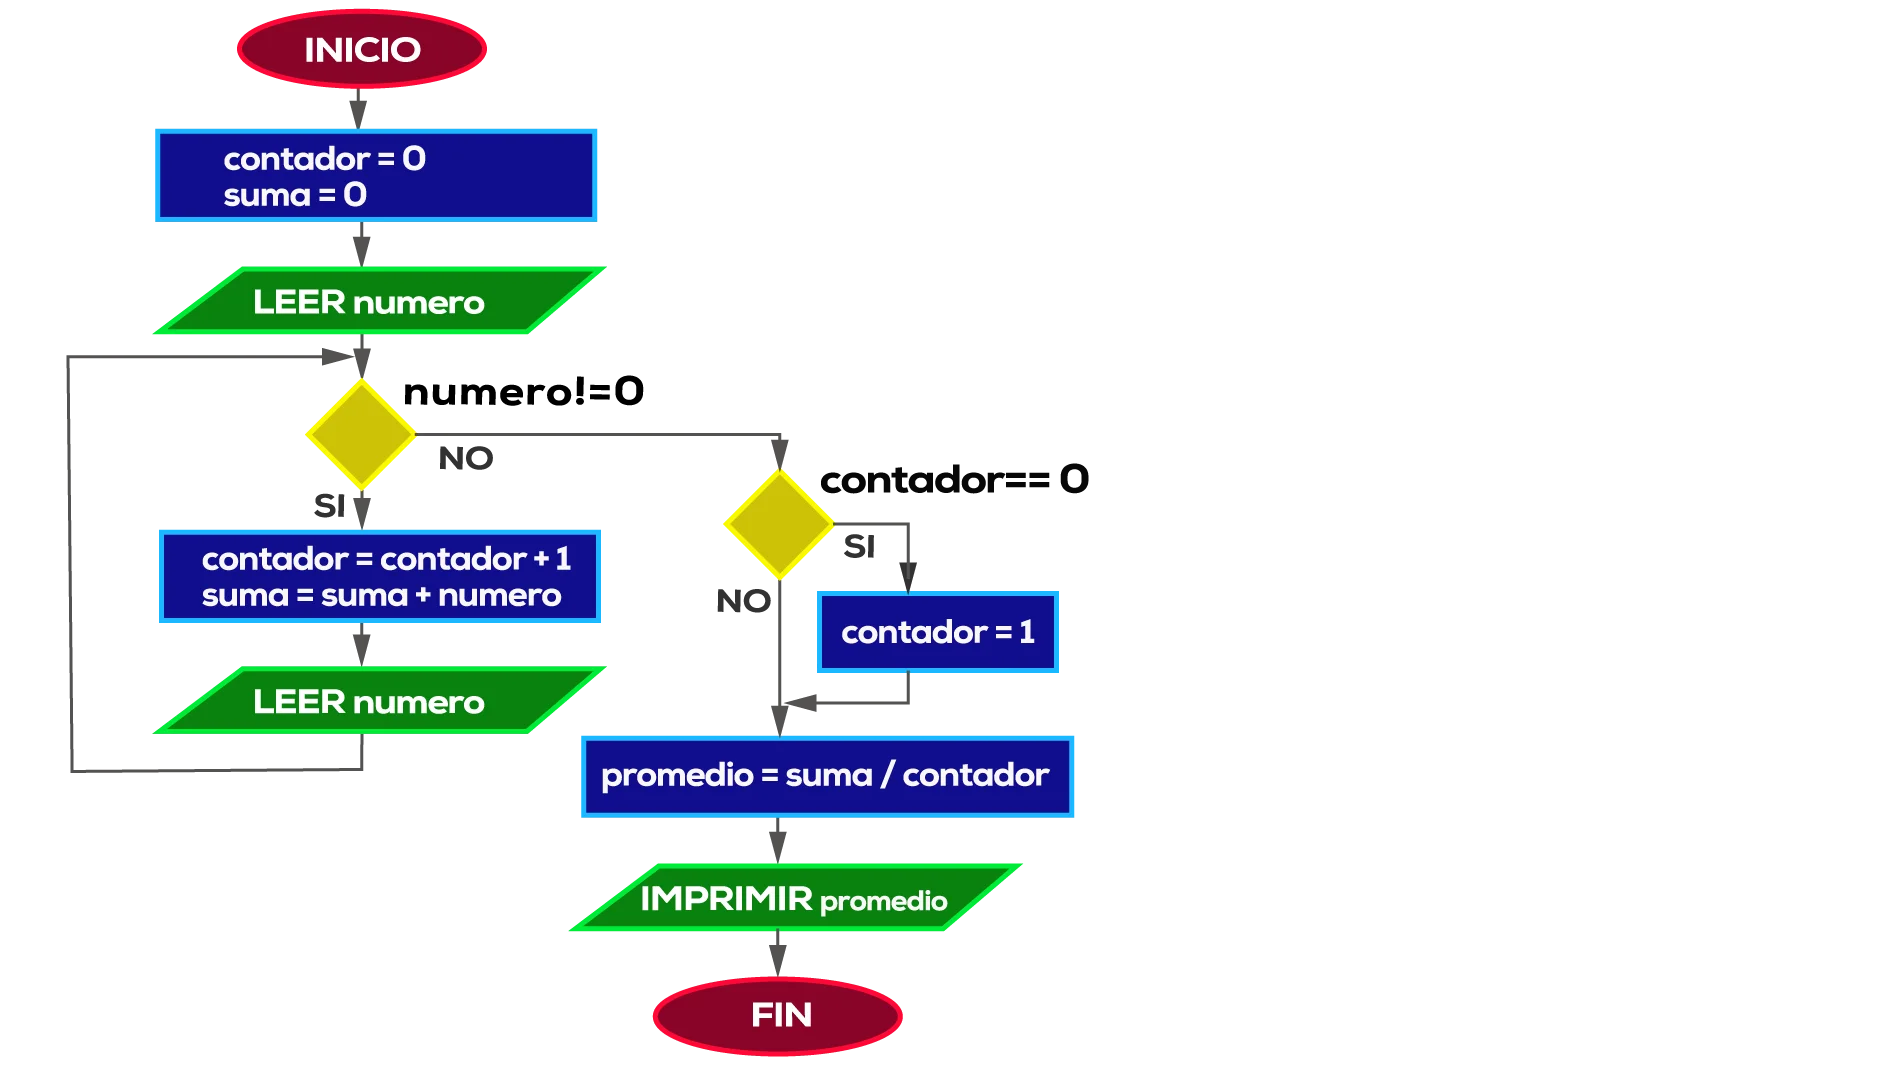
With an oval we mark the start. We will need a counter variable and a sum variable. With a process we initialize them to zero. We read the number, a parallelogram.
We have a condition, a rhombus, number <> 0. And here we will open two paths: the YES ? if it is different from zero, we sum the number to the sum variable, increment the counter, and read the number again.
For the path of number different from zero in NO ? we have to calculate the average, sum divided by counter, but if counter is zero it cannot be done (cannot divide by zero), so we will contemplate the counter equal to zero case. We build a rhombus; if counter is zero, we assign 1 to counter, and otherwise we continue.
We will unite the two outputs, YES and NO, with a line, as they follow the same path.
We make the calculation, assigned average to sum divided by counter, print the average value and finish the process.
The pseudocode of the program, for comparison purposes, would look like this:
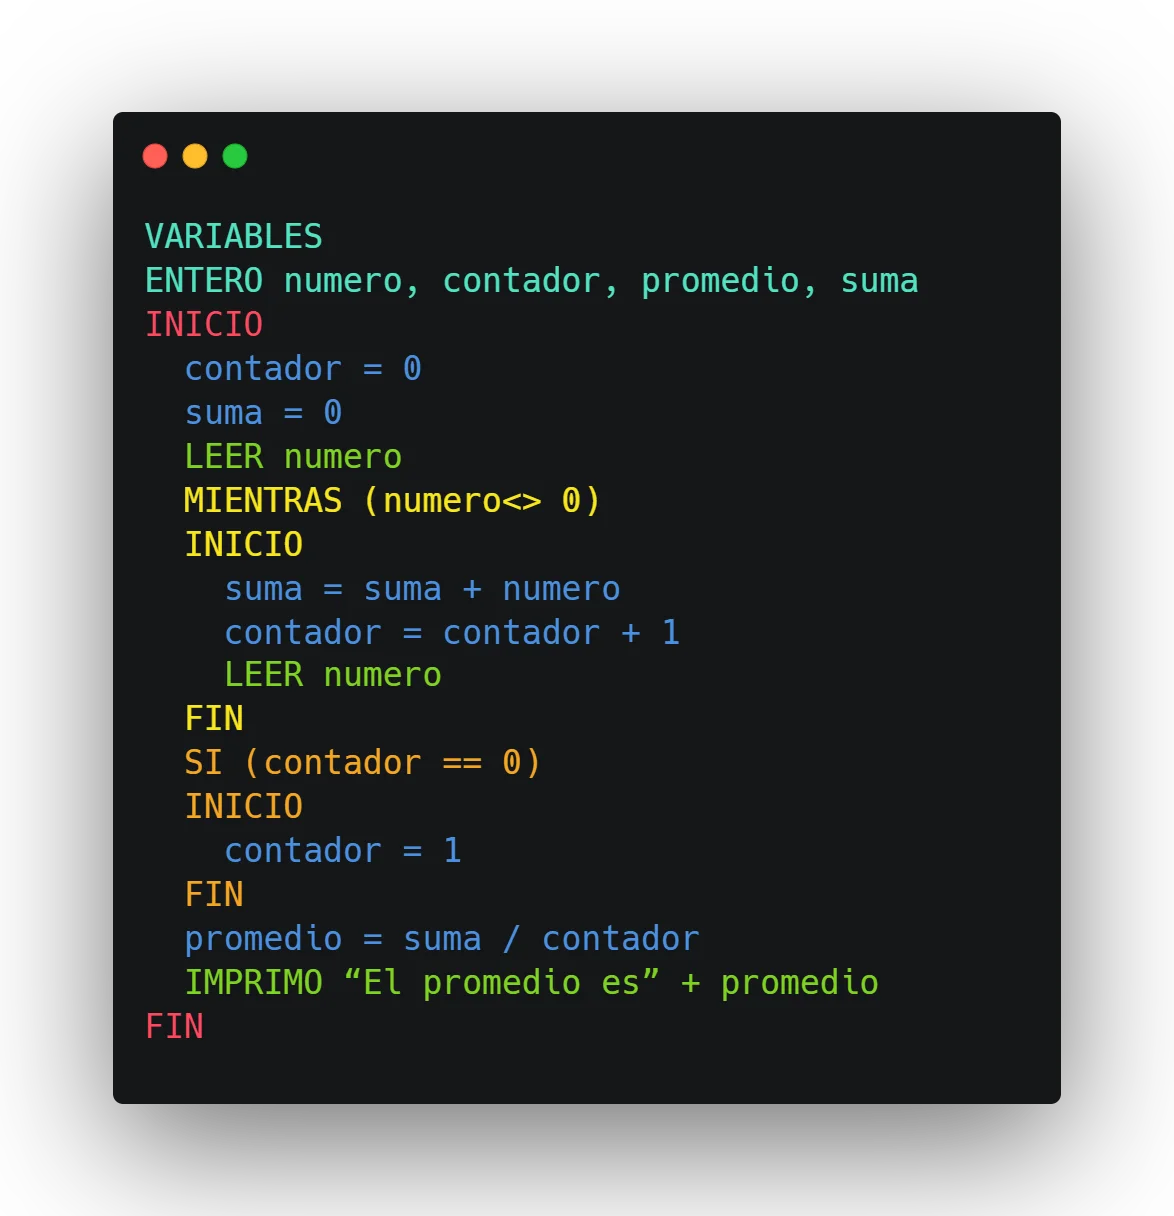
- We create the variables, initialize counter and sum to zero.
- We read number
- While number is different from zero, we sum it to the sum variable, increment the counter and read the next number again
- When the cycle ends, because number is zero, if counter is 0 we assign it 1, to be able to do the division
- We calculate the average
- We print the result.
This example was broader; here we have conditions and cycles.
With this we can understand flowcharts a bit better.
# Advanced exercise - Number guessing game
And to finish we will do much more difficult and complete exercise.
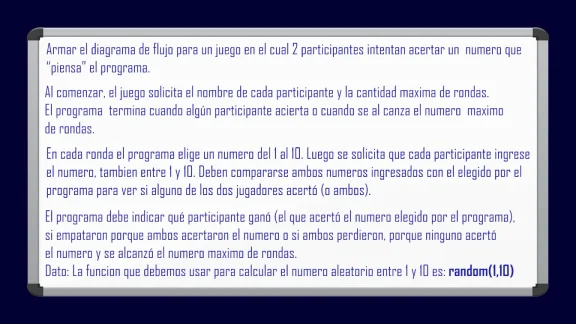
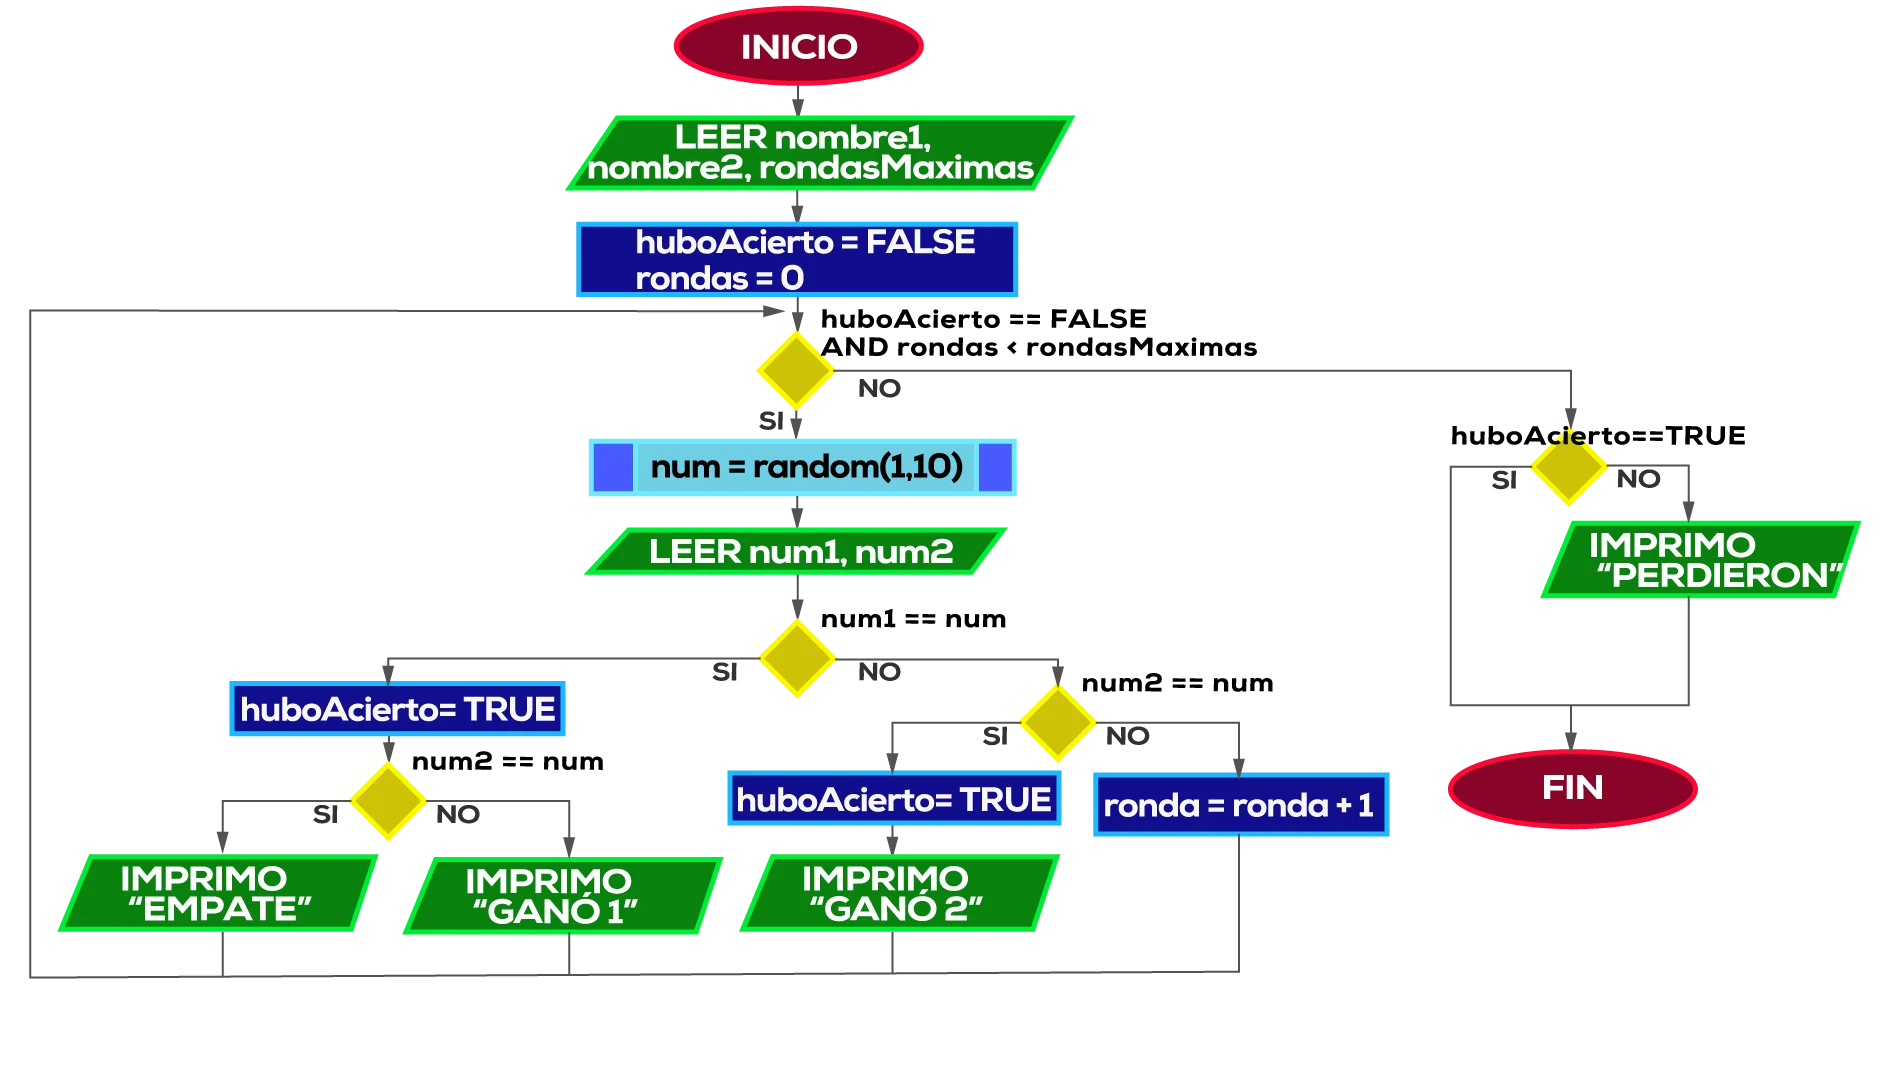
Here we are before a game; the first thing we must do is load the two names and the maximum rounds. We will need a round counter.
We have a cycle, until someone hits or the rounds exceed the maximum. For this we will need a boolean variable that indicates if there was a hit. Initially wasHit is false and the round counter starts at zero.
We are going to ask: Is wasHit false and rounds less than maxRounds?
By YES ? We generate the number to be guessed by the program with the random function, we assign it to the num variable.
We read the two numbers entered by the players: num1 and num2
We compare num1 equal to num: by YES, there is at least one winner, so we assign true to wasHit, player 1 may have won, we must see if player 2 also hit, because if both hit there is a tie.
We compare num2 with num: by YES, we print "TIE", by NO we print "PLAYER 1 WON".
Going back, if num1 is different from num: player 1 did not hit. We compare num2 with num; if they are equal, we assign true to the wasHit variable and I print "PLAYER 2 WON", otherwise neither of the two won, so by NO we increment the round counter.
We unite all these lines with the line that returns to evaluate the cycle condition.
We had already seen the YES side, we have yet to see the NO side; if it exited through here it is because wasHit is true or because we passed the maximum rounds. We compare wasHit with true; if there was a hit, I do nothing, I go to the end. If there was no hit, it means neither of the two hit, and the rounds were finished, so I print "BOTH LOST" and go to the end.
And thus we complete our diagram:
# Summary
In this chapter we saw flowcharts, a tool that helps us represent algorithms graphically, which gives us another way to think about and document them.
Like any tool, it can be more or less useful, according to each person. For some people, it helps them; for others, it may seem like a waste of time.
Personally, it seems like a very useful tool to me; I use it when I must think of complex algorithms.
link Resources used
- Image by tonodiaz on Freepik
- Image by brgfx on Freepik
- Image by rawpixel.com on Freepik
- Image from Freepik